A case study about solving business problems by using an experience journey framework, instead of an experience moment lens / republished on Medium.
What’s the difference between a moment and a journey? A moment happens briefly, whereas a journey is a collection of moments creating the story of an overall experience. You remember moments – yet it’s their amalgamation into a journey that creates sentiment and expectation: informing if people want to return for more, and what they expect to happen if they do.
Over the last year, I put this comparative framework to work while leading a design investigation into a business problem emerging across an entire customer journey: having a mortgage.
A team at a financial institution [FI] wanted to understand why experience metrics and feedback from people who’d experienced having their mortgages for a while indicated they were less satisfied with the FI than people who had just gotten their mortgage.
First: one measures a moment and a journey differently. The business had a KPI related to a moment in the relationship directly post-origination, but no one had been looking at longitudinal behavior or sentiment as it developed over time. I believed we needed to understand the entire post-origination mortgage customer journey, so as to identify which moments were impacting the overall experience. From there, I expected to facilitate stakeholders to identify immediate actions and roadmap longer term enhancements.
(All during the hottest housing market in history. No pressure.)
We started with a design sprint I facilitated, working with people across several teams to generate empathy and a shared understanding of what was happening well after the initial moment. We went in with the hypothesis that people wanted more ease around making payments, but we learned that people wanted a sense of control over their mortgage, which manifested at multiple moments.
The sprint output two journey maps: an empathy-based as-is to inspire, and a to-be with recommended changes, here:
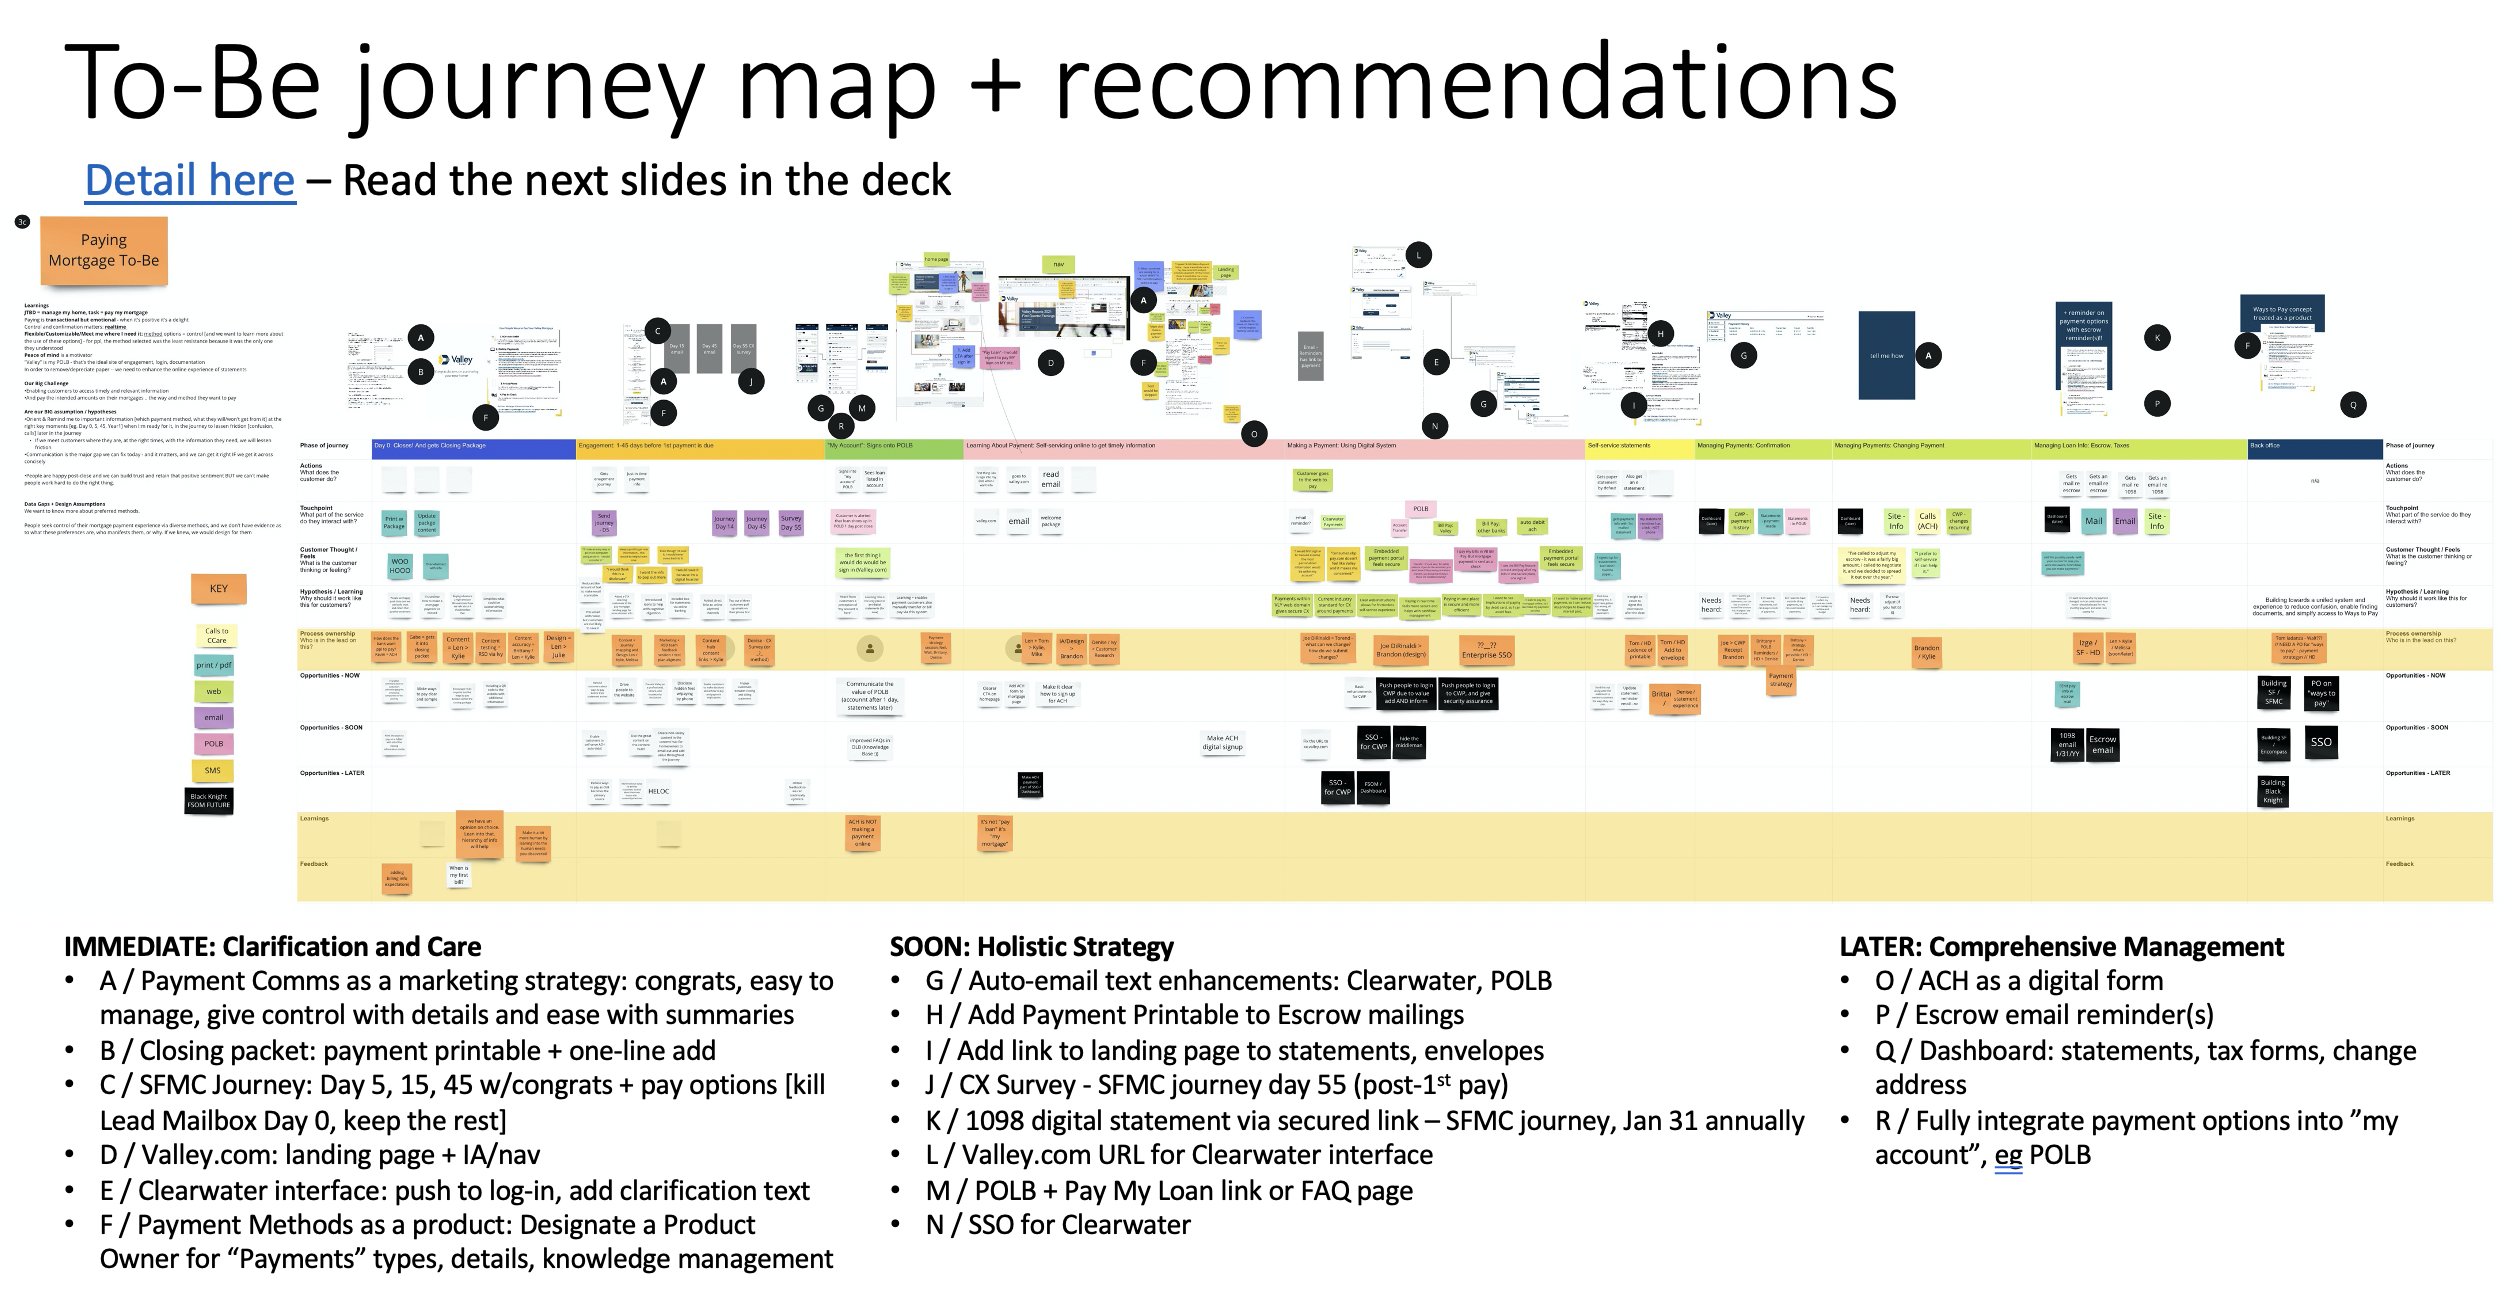
Product and marketing teams were able to pick up these recommendations and each activate on two of them, making major strides in eliminating the most common and painful digital and physical friction points in order to enable mechanisms of control.
After the sprint, in order to evaluate the impact of the changes above as well as prioritize next steps, we wanted to understand people’s behavior along the enhancements to the journey. The next phase involved creating listening posts and reporting to understand setting up payments, dealing with annual paperwork, and closing out your mortgage.
Once those were automated, we returned to the original business KPI, but this time with a longitudinal frame of reference. Working with analysts, we were able to understand frequency of key actions over a 5–7 year timeline, giving the organization it’s first view into long term customer behavior and sentiment, which answered questions like “how often might someone open a new account with us?”
Using a journey framework put all this data into an experience context: telling us “what.” Next, we needed to determine so what to do about it.
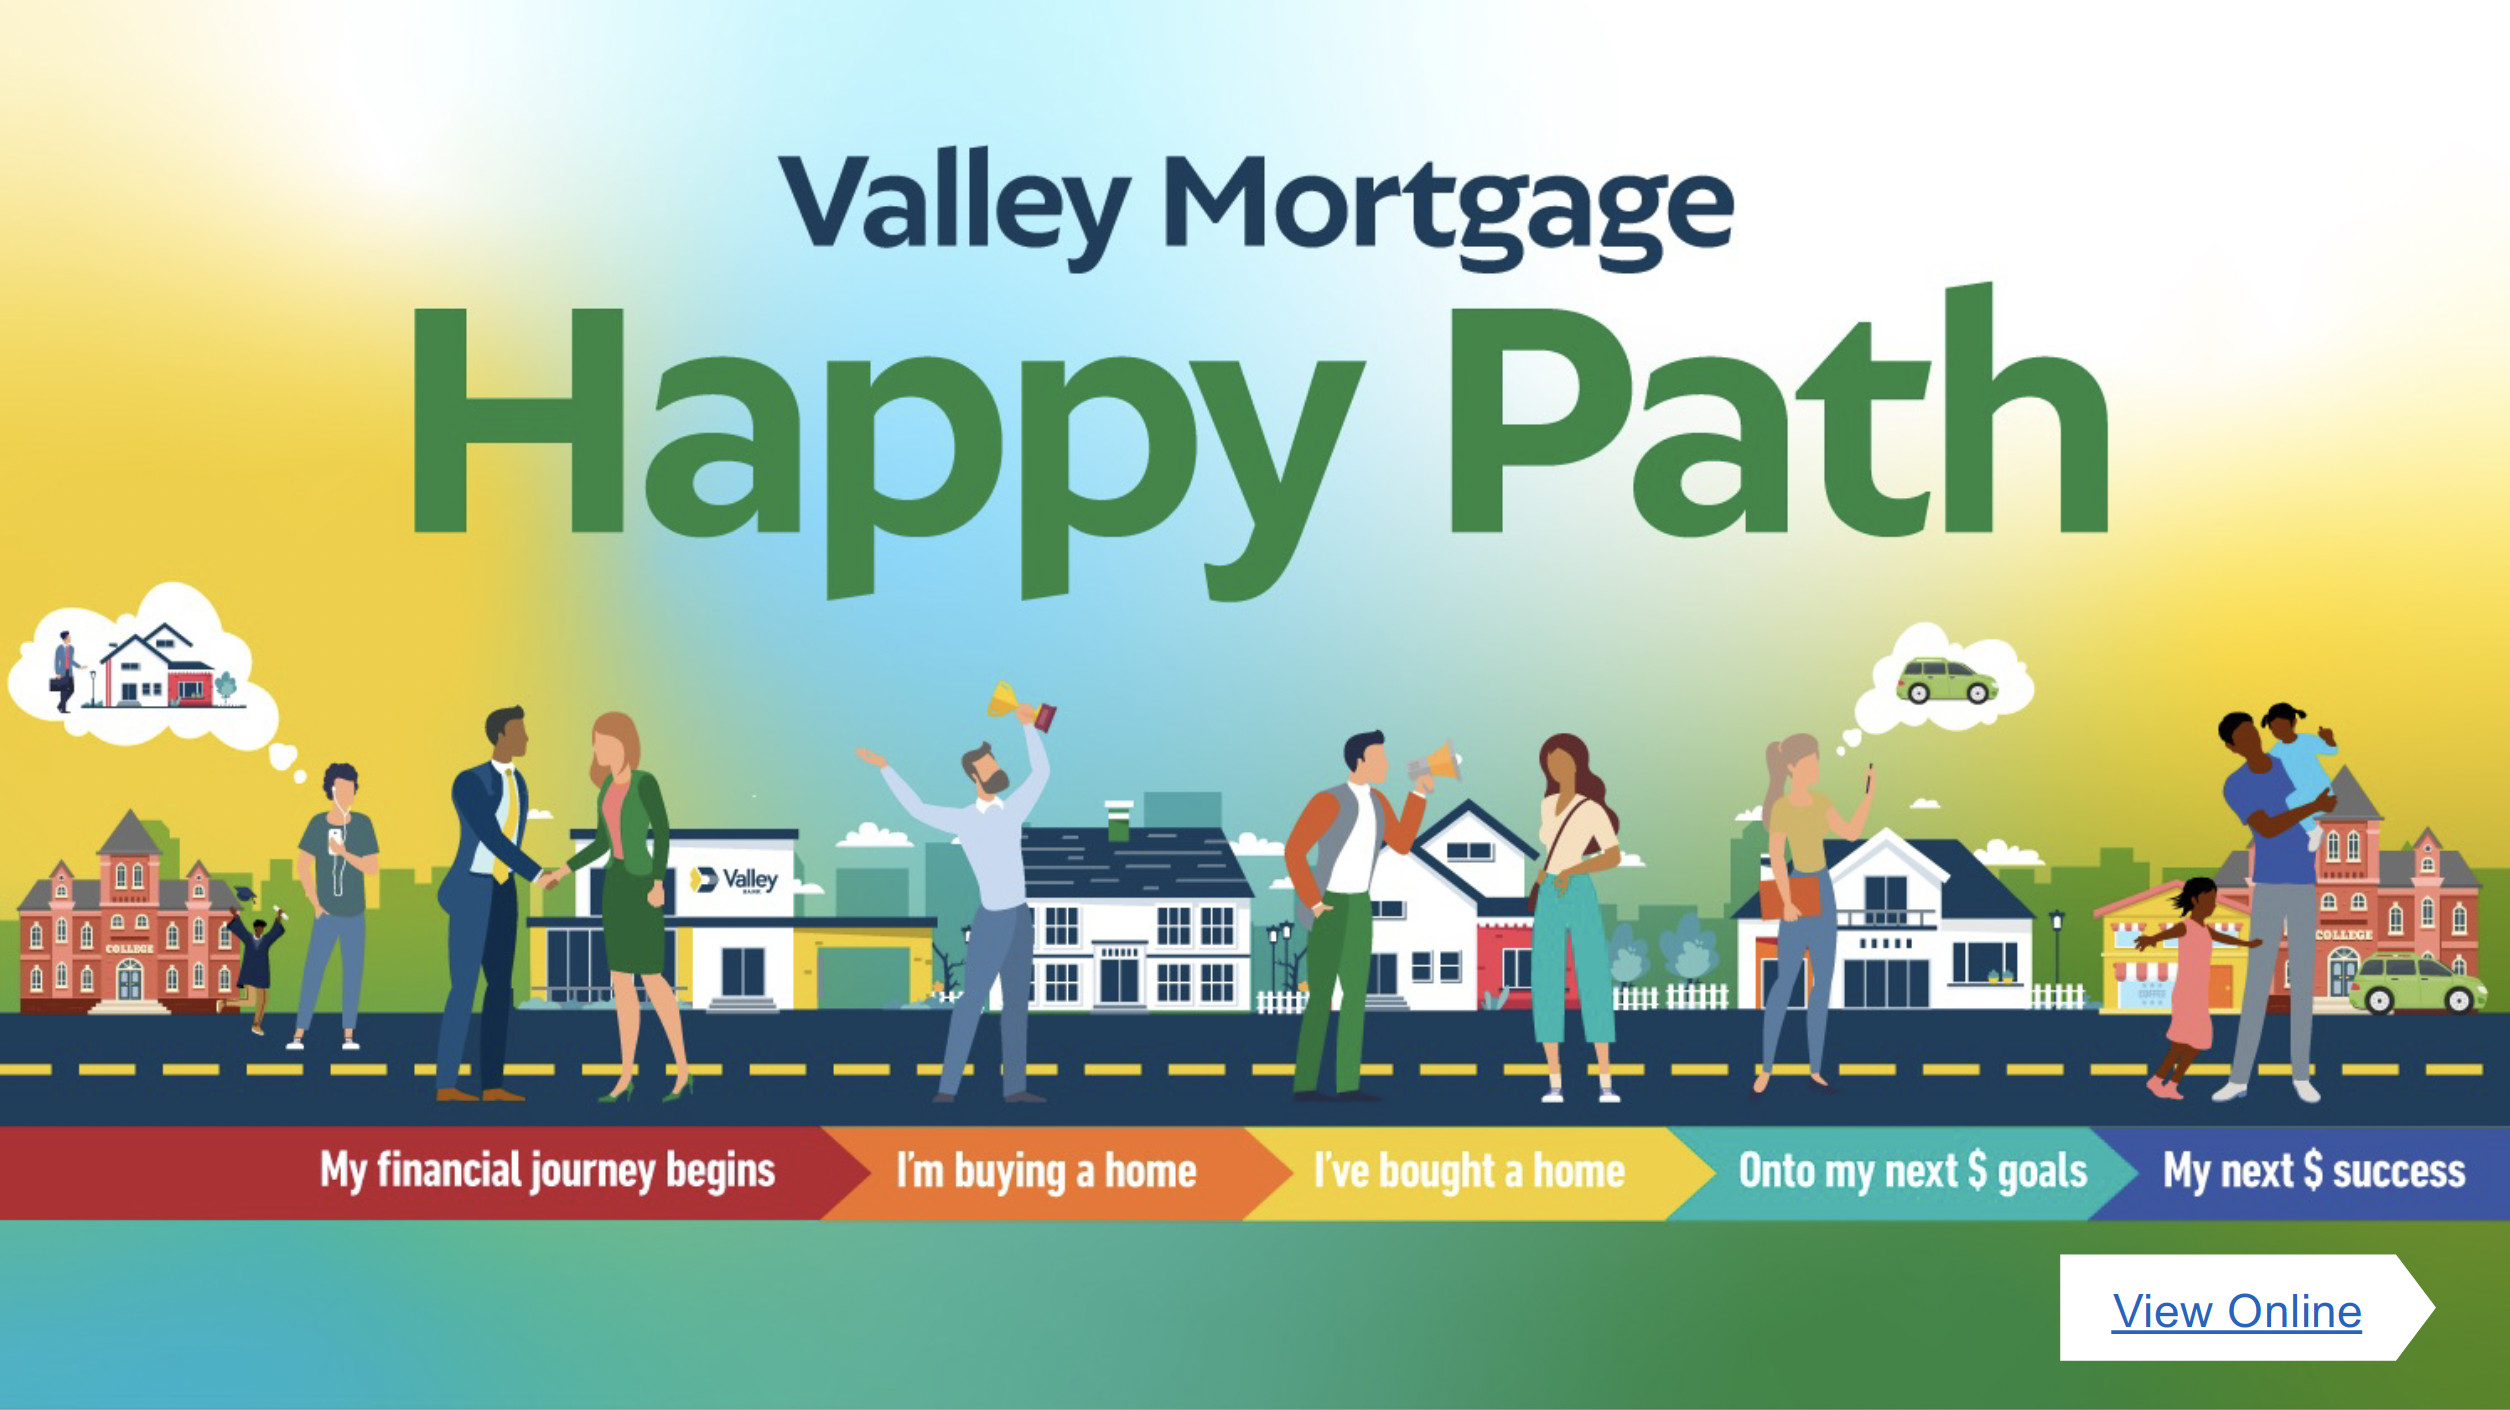
The final key was looking at people’s behavior from the lens of a “happy path” — as in, when everything is going “right” and people are enabled to achieve goals that matter to them, what do people do? On what timeline is success being driven by people? Using this, we could understand why and when actions were happening, and identify opportunities to enable more people to easily complete next steps that matter to them.
Importantly, my team had the data, business objectives, and customer feedback needed to create a meaningful story with a visual, which made the learnings and opportunities legible and actionable for stakeholders:

An outcome I’m especially proud of is creating a KPI baseline aligned to specific actions. Now that the FI’s stakeholders know that one in four customers go on to complete their longitudinal KPI — and why — they have a baseline from which to measure success.
If I were to do this exact project again, I would dive from the sprint into the behavior data more quickly. I would keep working with people from teams across the organization, as that made getting things done relatively efficient.
And I would absolutely continue creating shared ownership and understanding of the experience as a journey.